Behind the Advancements in Technology: How Flicker Effects Impact Displays and Lighting Products

Introduction
The core goal of display technology is to provide higher visual comfort and more accurate color reproduction. Flicker has emerged as a critical metric for assessing the quality of displays and lighting products. Flicker not only impacts visual comfort but also poses potential risks to visual task efficiency and health.
In this article, we will delve into the scientific theories behind flicker effects, measurement methods, and the technical challenges encountered in engineering applications. We will also analyze how various measurement standards can be utilized to enhance product quality.
This article will including below topics:
- The Physical and Physiological Basis of Flicker Effect
- Impact of Flicker on Vision and Health
- Measurement Methods and Standards for Flicker Effects
- Frequency domain Analysis Methods
- uFlicker Software: The Idea solution for Flicker Testing
The Physical and Physiological Basis of Flicker Effects
Flicker is a phenomenon caused by temporal fluctuations in light signals, with broad-ranging impacts primarily attributed to voltage variations in light source drivers and dimming technologies. It can be categorized into three main effects:
- Low-Frequency Visible Flicker
- Light fluctuations with frequencies below 80 Hz.
- Easily perceived by static observers, leading to visual fatigue, headaches, and even nervous tension.
- Common in unstable power supplies or LED lighting with low-frequency PWM dimming.
- High-Frequency Stroboscopic Effect
- Light fluctuations with frequencies between 80 Hz and 2 kHz.
- Affects the perception of moving objects under dynamic conditions, such as the wagon-wheel effect or motion blur.
- Often occurs in industrial lighting or high-refresh-rate displays, impacting dynamic visual performance.
- Phantom Array Effect
- Light fluctuations with frequencies above 2 kHz, which under certain motion conditions can create visual artifacts like multiple image trails.
- Though less common, it can affect user experience in high-speed motion environments.
Table 1: Classification of Flicker Phenomena
| Flicker Type | Low-Frequency Visible Flicker | High-Frequency Stroboscopic Effect | Phantom Array Effect |
|---|---|---|---|
| Frequency Range | < 80 Hz | 80 Hz - 2 kHz | > 2 kHz |
| Observation Conditions | Observing stationary objects in static environments | Observing moving objects in static environments | Observing stationary objects in dynamic environments |
| Phantom Ray Effect | Flicker | Stroboscopic Effect | Phantom Array Effect |
| Impact and Applications | Can lead to visual fatigue, headaches, and nervous tension. Commonly found in light sources with low-frequency PWM dimming or unstable power supplies. | Impacts the perception of moving objects, such as the wagon-wheel effect or motion blur. Common in industrial lighting or high-refresh-rate display devices. | Can create visual artifacts like multiple image trails, affecting user experience in high-speed motion scenarios. Less common but potentially significant in high-speed applications. |

Stroboscopic photography of a bike tire spinning.
Impact of Flicker on Vision and Health
Human sensitivity to flicker is closely related to the temporal resolution capabilities of the retina and nervous system. Studies have shown that low-frequency flicker, particularly in the range of 15-20 Hz, is most noticeable and can lead to the following issues:
- Visual Fatigue and Headaches: Prolonged exposure to low-frequency flicker environments increases the visual system’s accommodative burden.
- Visual Interference: Flicker can impair the ability to read text and discern fine details in images.
- Neurological and Psychological Effects: Individuals with photosensitive epilepsy may be particularly vulnerable to flicker stimuli.
The perception of flicker by the human eye is highly frequency-dependent:
- Below 70 Hz: Flicker effects are easily perceived and may significantly impact visual health and behavior.
- Above 70 Hz: Flicker effects are generally imperceptible, with minimal visual interference.
Furthermore, most behavioral impacts are concentrated on low-frequency amplitude effects under static conditions. These amplitude fluctuations are particularly notable in causing visual fatigue for stationary observers.

Prolonged Exposure to Low-Frequency Flicker Environments Can Cause Visual Fatigue and Headaches
Measurement Methods and Standards for Flicker Effects
Basic Measurement Parameters
Flicker measurements are based on the time-domain and frequency-domain characteristics of light signals. Core parameters include:
1. Percent Flicker:
Where A represents the maximum luminance value and B represents the minimum luminance value.
Applications:
- Suitable for quickly detecting the extent of light source fluctuations.
- Commonly used to test the basic stability of light sources.
Advantages:
- Simple calculation, making it ideal for embedded systems.
Disadvantages:
- Does not account for the combined effects of frequency and waveform.

2. Flicker Index
Flicker Index is determined using Area 1 and Area 2, which represent the areas under the waveform above and below the average light level.
Applications:
- More suitable for analyzing the stability of waveforms, especially for complex light source waveforms.
- Used in scenarios requiring evaluation of waveform energy distribution, such as LED lighting tests.
Advantages:
- Provides a more accurate representation of waveform characteristics compared to Percent Flicker.
Disadvantages:
- Less sensitive to frequency variations.

3. SVM(Stroboscopic Visibility Measure)
Definition and Formula of SVM
The Stroboscopic Visibility Measure (SVM) is a measurement standard specifically designed for high-frequency flicker in the range of 80 Hz to 2 kHz. Proposed by CIE TN006-2016, SVM aims to quantify the impact of high-frequency flicker on dynamic vision, particularly in applications involving fast-moving scenarios.
This metric employs a mathematical model to quantify the human eye’s sensitivity to high-frequency flicker, enabling engineers to evaluate the dynamic performance of light sources or displays. By providing a standardized approach, SVM helps in optimizing lighting and display technologies for environments where motion clarity is critical.
Applications:
- Display Testing: Evaluates the dynamic visual performance of high-refresh-rate displays (e.g., OLED or LCD panels).
- Industrial Lighting: Tests lighting fixtures used in high-speed production lines to prevent flicker interference with the observation of moving objects.
- Ensures that flicker effects do not compromise safety and efficiency in scenarios such as mechanical operations or traffic systems.

Cm: Fourier component of the light signal at a specific frequency.
Sm: Weighted sensitivity of the human eye to that frequency.
C1: Fourier component at the reference frequency
Advantages:
- Closely aligned with human visual perception models, accurately reflecting the real-world impact of high-frequency flicker on vision.
- Particularly suitable for high-speed display technologies (e.g., displays with refresh rates of 120 Hz or higher) and other high-frequency light sources.
- Unlike PstLM, which targets low-frequency flicker under static observation conditions, SVM is specifically designed for flicker testing under fast-moving scenarios.
4. PstLM(Short-Term Light Modulation Indicator)
PstLM is an indicator proposed by the International Electrotechnical Commission (IEC) to quantify the impact of low-frequency flicker (ranging from 0.3 Hz to 80 Hz) on human visual perception. Its primary purpose is to assess whether short-term flicker effects interfere with visual comfort.

Fi: The weighted component of flicker effects, based on perceptual weighting of observed frequency components.
N: The total number of frequency samples collected during the test duration.
PstLM is calculated using data collected by a Flicker Meter, with results reflecting the perceptibility of flicker effects from a light source.
Applications:
- Lighting Product Testing: Evaluates the flicker performance of LED luminaires and dimming devices to verify compliance with international flicker safety standards (e.g., IEC 61000-3-3).
- Power System Monitoring: Detects the impact of voltage fluctuations on light source flicker, ensuring light source stability.
- Investigates the potential effects of low-frequency flicker on the human eye and the nervous system.
Advantages:
- Provides precise data support for the visual impact of low-frequency fluctuations.
- Complements SVM’s high-frequency dynamic testing by focusing on low-frequency conditions under static observation scenarios.
Table 2: Comparison of Flicker Measurement Methods
| Method | Percent Flicker | Flicker Index | SVM | PstLM |
|---|---|---|---|---|
| Definition | Illuminating Engineering Society (IES), North America | Illuminating Engineering Society (IES), North America | PHILIPS & CIE TN 006:2016 | International Electrotechnical Commission (IEC) |
| Key Focus | Emphasizes relative waveform amplitude changes | Emphasizes waveform area ratio changes | Uses Fourier transform (time domain → frequency domain) combined with human visual frequency perception | Evaluates low-frequency flicker effects in the range of 0.3 Hz to 80 Hz |
| Indicator Range | 0% ~ 100%; smaller percentage → less flicker | 0 ~ 1; smaller value → less flicker | SVM ≤ 0.9 (before Sep 1, 2024); SVM ≤ 0.4 (after Sep 1, 2024) | PstLM < 1: Flicker not perceptible; PstLM = 1: 50% of people perceive flicker; PstLM > 1: Flicker noticeable |
| Measurement Characteristics | Simple and easy to use, suitable for quickly determining flicker levels | Provides a more accurate description of overall waveform stability; sensitive to low-frequency effects | Specifically designed for high-frequency flicker; strong dynamic analysis capabilities | Precisely quantifies short-term flicker effects; focuses on human visual perception |
| Applicable Scenarios | LED lighting, basic display testing | High-quality lighting, medical display testing | High-refresh-rate displays, high-speed motion environment lighting | LED luminaires, dimming devices, power system monitoring |
| Common Applications | Dimming detection of LED luminaires, low-frequency fluctuation testing of displays | Analysis of surgical lighting, office lighting performance | Testing OLED high-refresh displays, automotive lighting evaluation | Stability testing of LED lighting, voltage fluctuation impact on light sources |

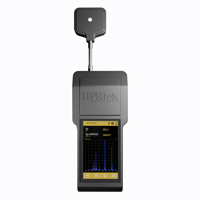
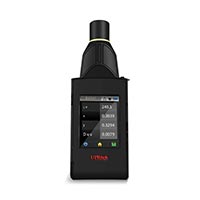
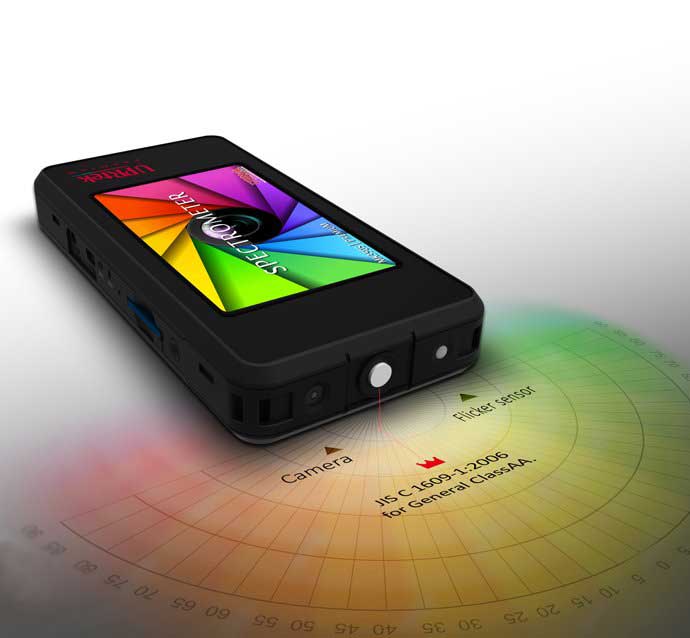
Flicker Measurement Interface

Identifiable Flicker Risk Zone
Frequency Domain Analysis Methods
1. JEITA Standards
The JEITA (Japan Electronics and Information Technology Industries Association) has established a flicker measurement method for displays, focusing on frequency domain analysis. This standard particularly evaluates high-frequency flicker effects as perceived by the human eye.
Frequency Domain Analysis:
- JEITA standards are based on Fast Fourier Transform (FFT), converting light signals from the time domain to the frequency domain.
- It analyzes the energy of each frequency component within the signal and applies weighted processing to each frequency.
- The weighting values are set according to the human eye’s sensitivity to different frequencies (perception curve).
Key Metrics:
Measurement results are typically expressed as the total energy of the weighted frequencies, quantifying the perceived effect of high-frequency flicker on the human eye.
Application Scenarios:
Used for dynamic performance testing of displays, including LCD and OLED panels.
2. VESA Standards
The VESA (Video Electronics Standards Association) is an international organization focused on display performance testing. The VESA flicker measurement method builds upon the JEITA framework, extending its applicability to a broader range of display technologies, particularly in dynamic contrast and high-refresh-rate evaluations.
Frequency Weighting:
- Similar to the JEITA method, VESA also utilizes FFT (Fast Fourier Transform) for frequency domain analysis.
- The key difference lies in VESA’s broader and more adaptable weighting range, making it suitable for most display technologies, including LCD, Mini-LED, and OLED.
Dynamic Contrast Testing:
Combines flicker effects with contrast variation in dynamic scenes, evaluating a display’s performance when rendering fast-moving images.
Application Scenarios:
- Flicker and contrast testing for High Dynamic Range (HDR) displays.
- Applicable to a wide range of display technologies, such as OLED, QLED, and Micro-LED.
Table 3: Comparison of JEITA and VESA Standards
| Feature | JEITA | VESA |
|---|---|---|
| Testing Scope | High-frequency flicker | High-frequency flicker + dynamic contrast |
| Weighting | Based on human eye perception curves | Broader weighting range, adaptable to more technologies |
| Applicable Technologies | LCD, OLED displays | LCD, OLED, HDR, and high-refresh-rate displays |
| Advantages | Precisely captures flicker closely related to human perception | More universal testing framework suitable for various display technologies |
| Challenges | High computational demand, requires efficient testing equipment | Complex testing framework with high requirements for dynamic content testing |

Flickering digital static texture.
uFlicker Software: The Ideal Solution for Flicker Testing
With the continuous advancement of display and lighting technologies, flicker effects have become a crucial indicator for assessing product quality. From basic measurements like Percent Flicker and Flicker Index to more advanced methods like SVM, accurate flicker testing helps engineers identify issues and improve designs, ultimately providing users with a more comfortable and stable visual experience.

Core Features of uFlicker Software
UPRtek’s uFlicker software is compatible with a variety of testing standards (Percent Flicker, Flicker Index, SVM, and PstLM) and combines the following key highlights:
1. Real-time Waveform and Spectrum Visualization:
- Provides both time-domain and frequency-domain analysis of light signals, helping users precisely identify the root causes of flicker.
- Waveform characteristics (such as symmetry and amplitude variation) clearly display the stability of the light signal.
2. Comprehensive Assessment of Amplitude’s Impact on Flicker:
- Analyzes the maximum, minimum, and shape of waveforms to evaluate the combined impact of amplitude changes on flicker effects.
- Helps engineers optimize light source dimming strategies, ensuring product stability under varying brightness conditions.
3. Impact of Waveform Characteristics on Flicker Evaluation:
- Waveform Symmetry: Affects the intuitive perception of flicker; asymmetric waveforms are more likely to cause visual disturbance.
- Waveform Frequency and Amplitude: High-frequency waveforms are not perceptible to the human eye, but low-frequency fluctuations, especially with high amplitude, significantly affect comfort.
- Waveform Light Intensity Distribution: Analyzes the light-dark ratio within the waveform (e.g., peak and trough differences), directly impacting the evaluation data of Percent Flicker and Flicker Index.
4. Multi-Parameter Testing Capability:
Provides detailed waveform parameters (peak value, trough value, waveform area) and integrates automated data processing features for rapid generation of visual reports.
5. Comprehensive Flicker Testing and Diagnostics:
- Evaluates the combined impact of amplitude and frequency to accurately categorize light source performance according to international standards.
- Integrates low-frequency assessments (PstLM) and high-frequency analysis (SVM) to perform flicker tests across the full frequency range.

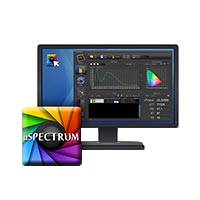
uFlicker software – a versatile tool designed specifically for flicker testing, precise and comprehensive.

uFlicker software delivers comprehensive flicker testing and professional analysis, redefining the standards of optical measurement.


Choosing uFlicker Software not only improves testing efficiency but also ensures product quality. With its comprehensive testing functions, precise waveform analysis, and amplitude impact assessment, it helps engineers create high-quality products that meet international standards. Additionally, the in-depth analysis of waveform characteristics allows the software to effectively diagnose flicker issues, offering critical supporting data for light source design and performance optimization.
Resources:
IES. (2011). The IES Lighting Handbook, 10th Edition. Illuminating Engineering Society of North America.
IEEE Standards Association. (2015). IEEE PAR1789-2015: Recommended Practice for Modulating Current in High Brightness LEDs for Mitigating Health Risks to Viewers. IEEE.
Miller, N. J. (2012). Comparative Analysis of Flicker Perception Thresholds in the Context of General Lighting. Lighting Research and Technology, 44(3), 213-223.
Wilkins, A. J., Veitch, J. A., & Lehman, B. (2010). LED Lighting Flicker and Potential Health Concerns: IEEE Standard PAR1789 Update. IEEE Energy Conversion Congress and Exposition.
CIE (Commission Internationale de l’Éclairage). (2019). CIE TN 006:2019 – Visual Aspects of Time-Modulated Lighting Systems. CIE.
Flicker Sense LED Screens, https://www.flickersense.org/background/led-screens
The Health Effects of Flickering Light, https://www.flickersense.org/
International Commission on Illumination https://etc.csu.edu.tw/flicker/
Hot Product
Handbook Series
The Flicker Handbook
Everything thing you need to know about Flicker, an insidious, potentially serious lighting artifact impacting visual safety for public places like hospitals, offices, libraries, and more...
About UPRtek
United Power Research and Technology
UPRtek (est. 2010) is a manufacturer of portable, high-precision light measurement instruments; Handheld Spectrometers, PAR meters, Spectroradiometers, Light Calibration Solutions.
UPRtek HQ, R&D and manufacturing are all based out of Taiwan, with Worldwide representation through our certified Global Resellers.
UPRTEK AT TOUCH TAIWAN 2025 – DISCOVER THE LATEST IN LIGHT MEASUREMENT TECHNOLOGY
Join Us at Booth L412 | April 16-18, 2025 | Taipei Nangang Exhibition Center
Latest Articles
Category
0 Comments